- Analytical methods
-
PLA 3.0
- About PLA 3.0
-
Analyze your data
- Analyze Biological Potency Assays
- Analyze quantal response assays
- Analyze the dose-response relationship
- Analyze the endotoxin concentration in a substance
- Develop Equivalence margins
- Determine the potency of antibiotics
- Perform a curve comparisons
- Perform a Linearity-of-dilution assessment
- Perform a sophisticated statistical process control
- Perform combination calculations
- Import your data
- Supporting add-ons
- Compliance features
- Deployment
- Try & Buy
- PLA 3.0 Academy
- Support
- Company
What's new in the Biological Assay Package Version 27

Load and watch this YouTube video now.

The Biological Assay Package version 27* provides major improvements to the user experience, outlier management, data processing, analysis capabilities, and assay monitoring.
*available for PLA 3.0.7 and higher
Refined user experience
_ Fresh look of the dashboard and reports
_ Complex analytical methods in a simple fashion
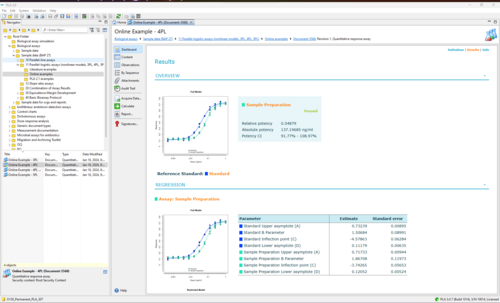
The new dashboard shows all main results at a glance, such as the sample potencies, the regression model, or the test status. You can also switch between tabs to view more information about the assay setup, and other useful details.
The reports provide comprehensive analysis results in a PDF file, now with hyperlinks for convenient navigation. Sample colors further support you in exploring the results.
The steps required to analyze an assay may become very complex. Use our newest version to make the configuration of dose sequences, combination calculation methods, or the development of equivalence margins feasible in a few minutes. Some areas even provide additional functions, such as using dilution factors to describe the dose sequence.
Advanced outlier management
_ More flexibility when dealing with potential outliers
_ New residual plots for investigation
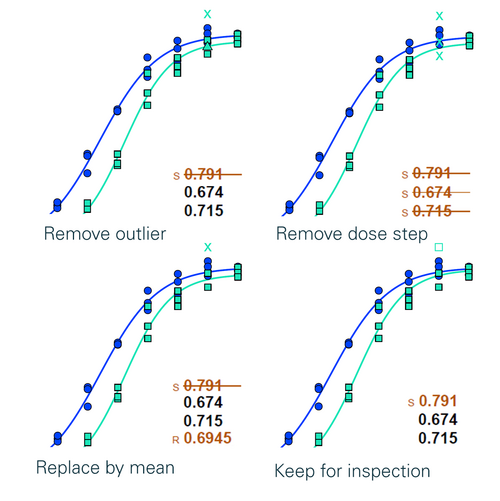
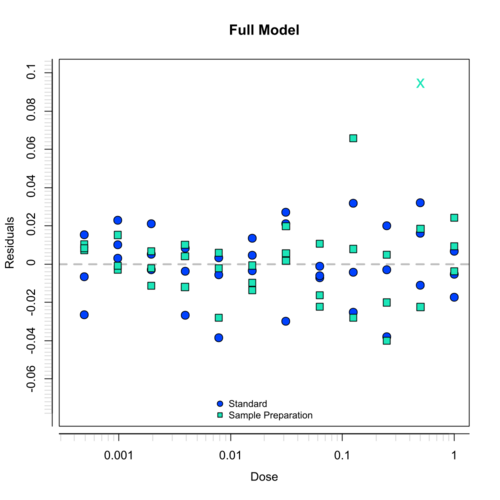
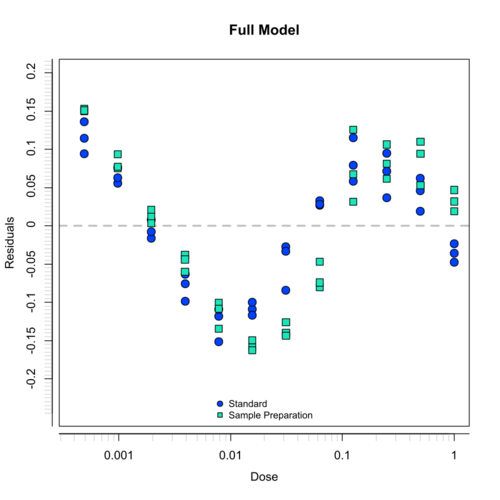
The new outlier handling options allow you to cover all kinds of scenarios. Gain full control and decide whether to remove the outlying value or the entire dose step. You can also replace the outlier by the mean of the dose step or keep it in the analysis for inspection. The reports now also contain residual plots, which support you in revealing differences between assay data and the estimated regression model. For example, they allow you to inspect detected outliers or verify the regression model.
Additional data processing tools
_ Block-based adjustments & normalization
_ Replicate averaging
_ Multiple response columns
The Biological Assay Package 27 provides new data processing tools to support block-based adjustments and normalization, replicate averaging, and multiple response columns!
Adjust and normalize data within blocks based on your assay layout. For example, shift data to an established baseline, create block-adjusted data sets, and account for plate or litter effects. You can also calculate the replicate mean for more accurate results when using pseudoreplicates.
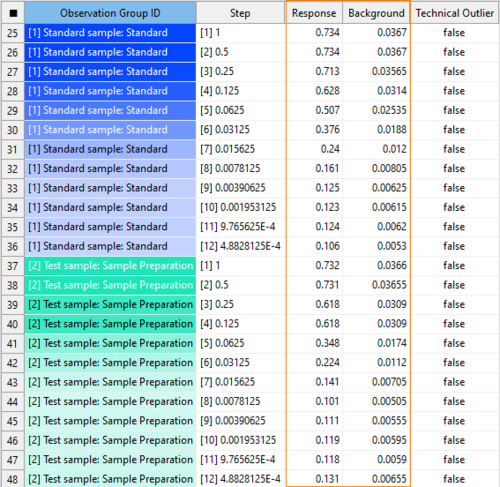
The Quantitative response assay document now supports multiple response columns. Maintain all related data in one place and be less reliant on external tools! For example, enter data from different measurement times or absorbance spectra. Or compare signal to noise. You can also calculate the difference of response columns to use for assay analysis.
Elaborated analysis capabilities
_ Additional results to qualify the assay
_ Refined ANOVA with blocking
_ Extended control over acceptance criteria
We further elaborated the analysis capabilities of the add-on.
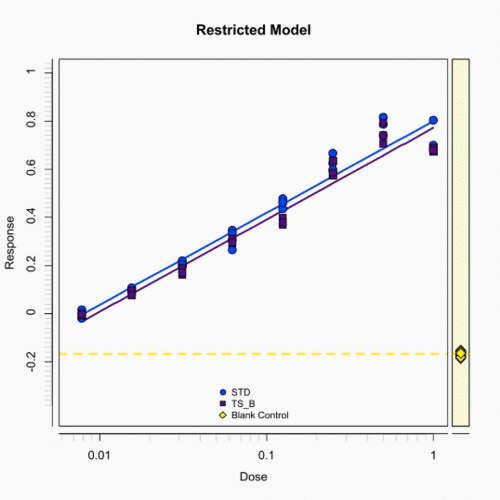
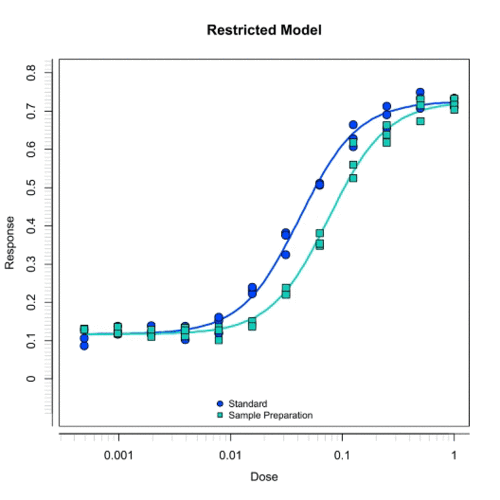
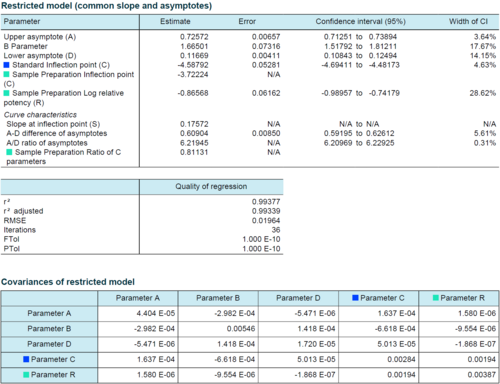
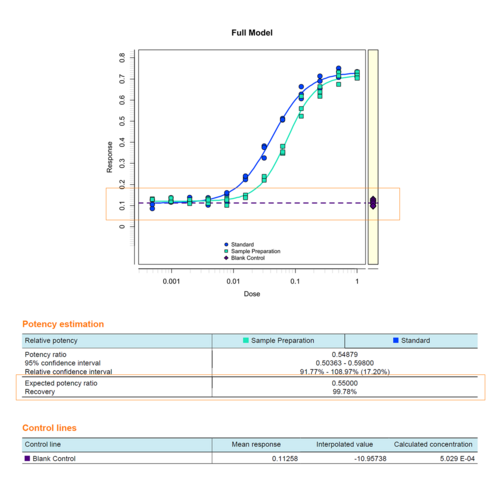
The regression model now includes valuable information about parameter confidence intervals, curve characteristics, the root mean square error, and parameter covariances. You can also calculate the recovery rate of the sample potency and interpolate Control lines based on the Standard curve.
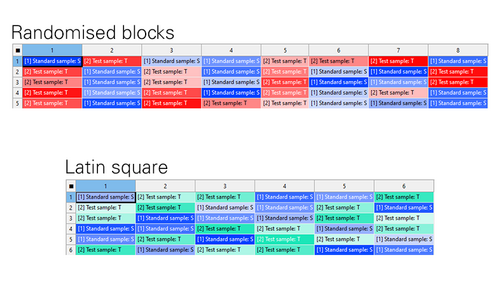
You now have the option to provide confounding factors to the ANOVA to explain additional variance in your data. Not only can you cover complex plate designs, but also account for plate or litter effects, edge effects, and replication effects.
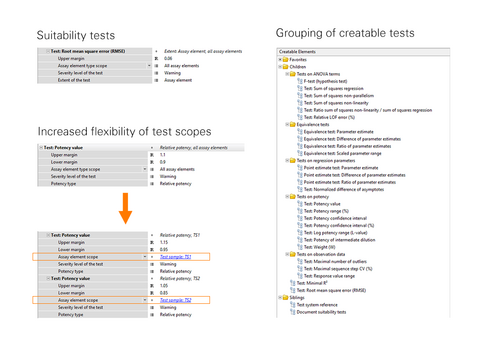
The newest update also contains additional suitability tests to meet the state-of-the-art requirements of our customers. All creatable tests are now grouped for your convenience. In addition, we increased the flexibility of test scopes. Pointing tests directly to a specific sample now allows variability in the margins, for example.
Enhanced support for assay monitoring
_ Trending of additional values
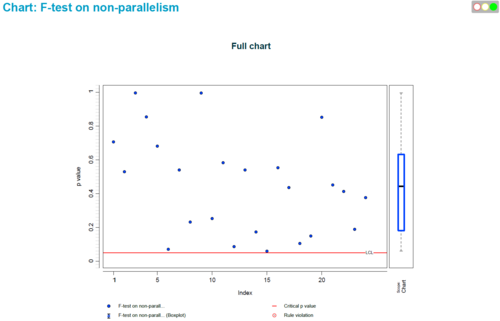
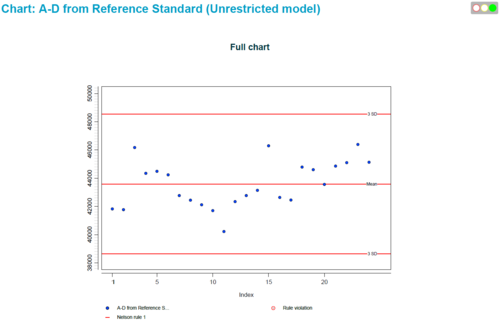
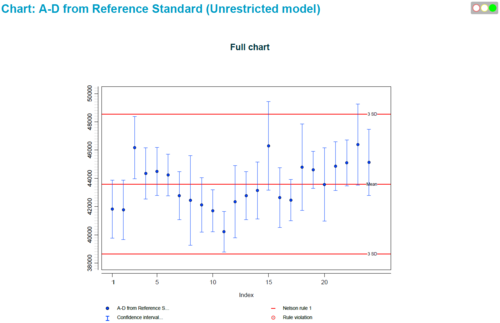
You can now trend values of test results like the p value from the F-test on parallelism. Additional curve characteristics are also available, now, together with their confidence intervals. Create fully customizable charts with the Control Chart Package for PLA 3.0, and discover conspicuous patterns in your assay data!
