-
PLA 3.0
- PLA 3.0 Virtual booth
- ---
- Explore PLA 3.0
- Compliance features
- Deployment
- ---
-
Experiments
- Parallel-line potency assays
- Parallel logistic potency assays (3PL, 4PL, 5PL)
- Slope ratio potency assays
- Quantal response potency assays
- Interpolation analysis
- Effective-concentration calculation (ECn)
- Spike-and-recovery analysis
- Cylinder-plate assays
- Turbidimetric assays
- ---
- Analyze the endotoxin concentration in a substance
- Import your data
-
Analyze your data with PLA 3.0
- Analyze Biological Potency Assays
- Analyze quantal response assays
- Analyze the dose-response relationship
- Analyze the endotoxin concentration in a substance
- Develop Equivalence margins
- Determine the potency of antibiotics
- Perform a curve comparisons
- Perform a Linearity-of-dilution assessment
- Perform a sophisticated statistical process control
- Perform combination calculations
- Advanced analysis
- Monitoring
- Supporting add-ons
- ---
- Event Calendar
- News
- Newsletter
- Get started
- Downloads
- Company
Curve comparisons
Individually plot Test samples, and use the document dashboard or one of the document reports to compare the resulting curves. We support various analytical (regression) models.
Please note: All assay elements within a Dose-response analysis document use the same analytical model.
The following image shows plots and regression results for Test sample CURVE1.
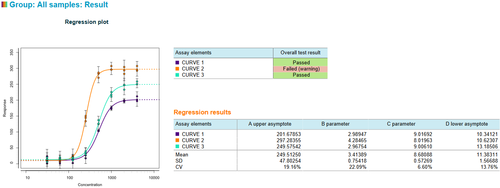
The following image shows regression plots for three multi-dose samples.
Example report of a Curve Comparison with PLA 3.0
-
Example report of a Curve Comparison with PLA 3.0 202 KB
This report is intended to show the curve-comparison capabilities of the Dose-Response Analysis Package for PLA 3.0. It contains (artificial) observations for three samples with measurements taken in triplicate at eight concentrations along a two-fold geometric sequence. For each sample, a four-parameter logistic curve is fitted to the data, and suitability tests are evaluated. All samples are collected in a report group. For this group, an overlay plot is created, and the parameters of the fits are compared. The three samples in this document also showcase three different ways to define the concentration of a sample: 1. By defining the stock solution of the analyte (Curve 1) 2. By defining the initial concentration of your dilution sequence (Curve 2) 3. By defining the concentration of the raw material used for stock solution preparation (Curve 3)

