-
PLA 3.0
- PLA 3.0 Virtual booth
- ---
- Explore PLA 3.0
- Compliance features
- Deployment
- ---
-
Experiments
- Parallel-line potency assays
- Parallel logistic potency assays (3PL, 4PL, 5PL)
- Slope ratio potency assays
- Quantal response potency assays
- Interpolation analysis
- Effective-concentration calculation (ECn)
- Spike-and-recovery analysis
- Cylinder-plate assays
- Turbidimetric assays
- ---
- Analyze the endotoxin concentration in a substance
- Import your data
-
Analyze your data with PLA 3.0
- Analyze Biological Potency Assays
- Analyze quantal response assays
- Analyze the dose-response relationship
- Analyze the endotoxin concentration in a substance
- Develop Equivalence margins
- Determine the potency of antibiotics
- Perform a curve comparisons
- Perform a Linearity-of-dilution assessment
- Perform a sophisticated statistical process control
- Perform combination calculations
- Advanced analysis
- Monitoring
- Supporting add-ons
- ---
- Event Calendar
- News
- Newsletter
- Get started
- Downloads
- Company
Analyze Biological Potency Assays
The Biological Assay Package (available as a free add-on) supports multiple use cases and is well known for its analysis of biological potency assays. Use our Biological Assay Package to analyze quantitative response assays according to Chapter 5.3 of the European Pharmacopoeia and US Pharmacopeia <111>, <1032>, <1033>, <1034>. The package supports the following methods
- Parallel-line assays [pic.1]
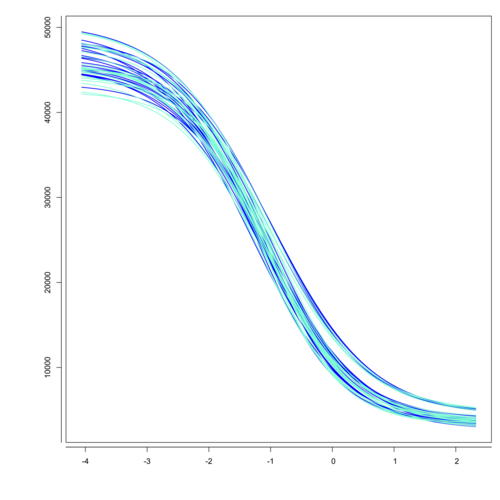
- Parallel logistic assays (3PL, 4PL, 5PL) [pic.2]
- Slope ratio assays [pic.3]
From development and optimization to validation and subsequent use in routine operation. The package supports you throughout your entire biological assay life cycle, so take advantage of our advanced analysis tools. The Biological Assay Package supports all weighting methods for combination calculations as required by the relevant guidances. This includes unweighted combination calculations, as well as advanced methods that take into account inter- and intra-assay variation. Enjoy automatic aggregation of independent assay data, providing you with a seamless method that simplifies the task of developing candidate equivalence margins. Simplify intricate workflows using the Basic Bioassay Protocol, a powerful tool designed to streamline the most common processes in bioassay analysis.
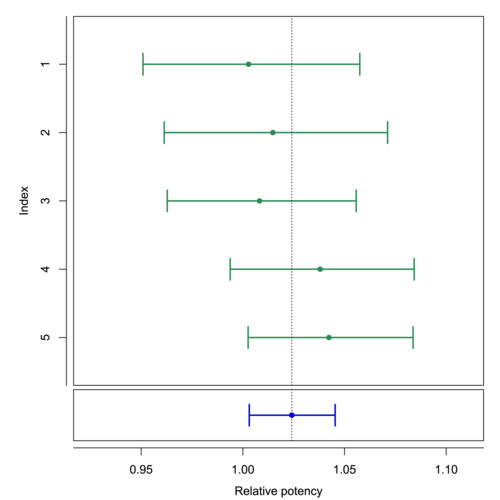
- Combination calculation [pic.4]
- Equivalence margin development [pic.5]
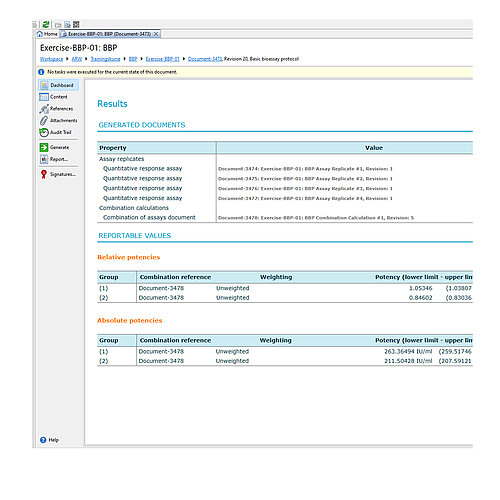
- Basic Bioassay Protocol [pic.6]
For the evaluation of Dichotomous assays (quantal response assays, binary assays) according to Chapter 5.3 of the European Pharmacopoeia and US Pharmacopeia <111>, <1032>, <1033>, <1034> we provide the Dichotomous Assay Package for you.
Example reports
-
Example report of a Parallel-line assay analyzed with PLA 3.0 71 KB
Based on European Pharmacopoeia, 5th Edition (2005), Chapter 5.3 5.1.4 Five-dose multiple assay with completely randomised design - An in-vitro assay of three hepatitis B vaccines against a standard Remarks: Multiplex analysis
-
Example report of a nonlinear quantitative response assay analyzed with PLA 3.0 81 KB
Based on European Pharmacopoeia, 5th Edition (2005), Chapter 5.3, 5.4.1.a - Four-parameter logistic curve analysis, A serological assay of tetanus sera.
-
Example report of a slope ratio assay with PLA 3.0 81 KB
Based on European Pharmacopoeia, 5th Edition (2005), Chapter 5.3, 5.2.2. - A completely randomised (0,4,4,4)-design - An in-vitro assay of influenza vaccines.
-
Example Combination of Assay Results with PLA 3.0 28 KB
The report contains a combination calculation for relative potency results, based on European Pharmacopoeia 6.0, chapter 5.3. As described in European Pharmacopoeia up to the 9th edition, 'Heterogeneous Weighting' was selected as the combination method. Page 1 is a typical PLA 3.0 report title page with basic information on the document and the database. Information on electronic document signatures would be also shown here. Page 2 shows a table with the general properties of the whole document. The source data is taken from reference documents (assays), calculated using PLA 3.0. The data is structured into two groups. The results of each group are listed separately. Page 3 shows the results for group 1. Page 4 shows the results for group 2. For each group, the results of the source data were combined according to the configured calculation method. The top-most table in each group contains details on the source data. The following table lists the values and a set of resulting calculations. The 'Tests on combination result' section lists the results of the suitability tests. In the sample document, a test for a combined relative potency value was set up. The 'Calculation of the combined relative potency and 95% confidence limits' section shows the corresponding test results. The plot shows the input values and the results.
-
Example of an Equivalence margin development report with PLA 3.0 679 KB
The report is split into five sections. The first section provides an overview about the source assays. The second section shows the developed equivalence margins. Section three contains an overview about the utilized test strategies. In section four, these strategies are verified against each development and verification assay. And section five visualizes the behaviour of the strategies by running simulations for acceptable assay systems.


