-
PLA 3.0
- PLA 3.0 Virtual booth
- ---
- Explore PLA 3.0
- Compliance features
- Deployment
- ---
-
Experiments
- Parallel-line potency assays
- Parallel logistic potency assays (3PL, 4PL, 5PL)
- Slope ratio potency assays
- Quantal response potency assays
- Interpolation analysis
- Effective-concentration calculation (ECn)
- Spike-and-recovery analysis
- Cylinder-plate assays
- Turbidimetric assays
- ---
- Analyze the endotoxin concentration in a substance
- Import your data
-
Analyze your data with PLA 3.0
- Analyze Biological Potency Assays
- Analyze quantal response assays
- Analyze the dose-response relationship
- Analyze the endotoxin concentration in a substance
- Develop Equivalence margins
- Determine the potency of antibiotics
- Perform a curve comparisons
- Perform a Linearity-of-dilution assessment
- Perform a sophisticated statistical process control
- Perform combination calculations
- Advanced analysis
- Monitoring
- Supporting add-ons
- ---
- Event Calendar
- News
- Newsletter
- Get started
- Downloads
- Company
Linearity-of-dilution assessment
Determine the precision of your method at different levels of dilution.
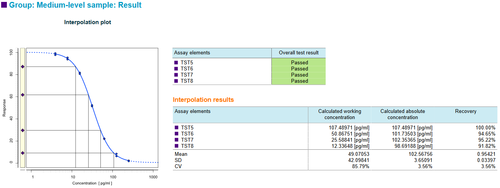
The following image from the 'Linearity of dilution assessment' sample document shows results for an undiluted Test sample and three dilutions of the undiluted sample. Predilution factors are assigned to the diluted samples. The concentration is defined as the determined concentration of the undiluted sample.
Note how the interpolation results show the difference between the working concentration of the Test sample on the plate and the absolute concentration of the undiluted Test sample.
Example report of a Linearity-of-dilution assessment with PLA 3.0
-
Example report of a Linearity-of-dilution assessment with PLA 3.0 426 KB
This report shows how to use the Dose-Response Analysis Package for PLA 3.0 to perform linearity of dilution assessment. It contains (artificial) observations for a standard sample and 12 test samples. The standard is measured along a two-fold geometric sequence with seven steps where each measurement is taken in duplicate. Each test sample is measured in triplicate. The test samples are grouped into three groups of four samples each, corresponding to a serial dilution of three underlying samples representing three different initial concentrations. The concentration of the undiluted (neat) sample is assigned to all diluted samples of its group, and recoveries are calculated and tested. Additionally, all test samples belonging to the same 'neat' sample are collected in a report group, and a combined recovery for each group is calculated.
