-
PLA 3.0
- PLA 3.0 Virtual booth
- ---
- Explore PLA 3.0
- Compliance features
- Deployment
- ---
-
Experiments
- Parallel-line potency assays
- Parallel logistic potency assays (3PL, 4PL, 5PL)
- Slope ratio potency assays
- Quantal response potency assays
- Interpolation analysis
- Effective-concentration calculation (ECn)
- Spike-and-recovery analysis
- Cylinder-plate assays
- Turbidimetric assays
- ---
- Analyze the endotoxin concentration in a substance
- Import your data
-
Analyze your data with PLA 3.0
- Analyze Biological Potency Assays
- Analyze quantal response assays
- Analyze the dose-response relationship
- Analyze the endotoxin concentration in a substance
- Develop Equivalence margins
- Determine the potency of antibiotics
- Perform a curve comparisons
- Perform a Linearity-of-dilution assessment
- Perform a sophisticated statistical process control
- Perform combination calculations
- Advanced analysis
- Monitoring
- Supporting add-ons
- ---
- Event Calendar
- News
- Newsletter
- Get started
- Downloads
- Company
Interpolation analysis
Plot the observation data of the Standard sample and the Test samples, calculate the standard curve and determine the unknown concentration by interpolation on this curve.
Example of an interpolation analysis with PLA 3.0
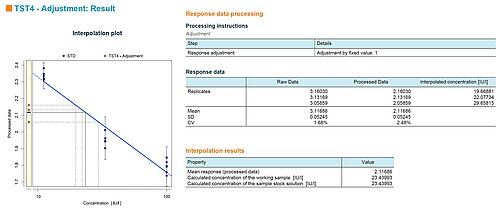
The following image from the 'Linear calibration curve (enhanced response data processing)' sample document shows results for Test sample TST4, with response data being adjusted by a fixed value of '1'.
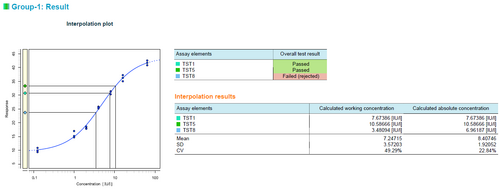
The following image from the '4PL calibration curve' sample document shows results for Test samples TST1, TST5, and TST8. Response values are interpolated on a calibration curve. The interpolation results are displayed in a data plot and as a table.
The sample document has been enhanced as follows:
- For better readability of the resulting interpolation plot, a subgroup has been added to the sample document, with the three Test samples being assigned to it.
- An additional Sample suitability test has been defined for Test sample TST8.
- An additional predilution factor has been assigned to Test sample TST8, resulting in the calculated working concentration and the calculated absolute concentration to differ from each other by this factor.
Example report of an Interpolation Analysis with PLA 3.0
-
Example report of an Interpolation Analysis with PLA 3.0 2 MB
This report shows the interpolation capabilities of the Dose-Response Analysis Package for PLA 3.0. It contains (artificial) observations for a four-parameter logistic standard curve and 75 test samples. The standard is measured at seven concentration steps, with three replicates for each concentration. Each test sample is measured with one replicate. Test samples are interpolated against the standard curve, concentrations are determined, and sample suitability tests are evaluated.

