- Analytical methods
-
PLA 3.0
- About PLA 3.0
-
Analyze your data
- Analyze Biological Potency Assays
- Analyze quantal response assays
- Analyze the dose-response relationship
- Analyze the endotoxin concentration in a substance
- Develop Equivalence margins
- Determine the potency of antibiotics
- Perform a curve comparisons
- Perform a Linearity-of-dilution assessment
- Perform a sophisticated statistical process control
- Perform combination calculations
- Import your data
- Supporting add-ons
- Compliance features
- Deployment
- Try & Buy
- PLA 3.0 Academy
- Support
- Company
Slope ratio potency assays
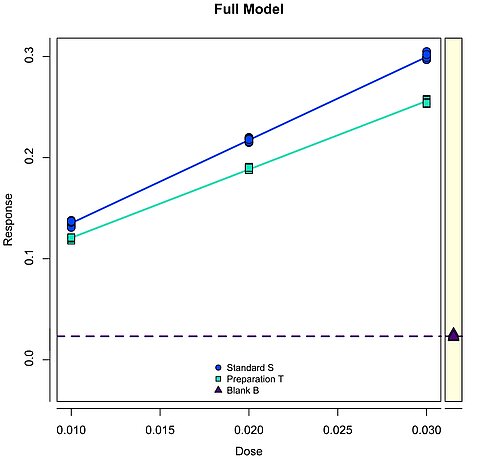
Slope-ratio assays are very similar to parallel-line assays insofar as both are indirect analytical assays, which aim to estimate the potency of a test sample relative to that of a standard. Slope-ratio assays are most often encountered in microbiologic applications and in cell and gene assays. As with a parallel-line assay, the key assumption is that the expected response to a given dose of the test sample is the same as that which would be obtained from the standard sample administered at a dose that is p times the given dose. As in parallel-line assays, the parameter p is known as the relative potency.
Unlike the parallel-line assay, the expected response is linear in the dose, not its logarithm. The graphs of the response against dose for test and standard samples will be straight lines of different slopes and common intercept, as the assumptions of the assay demand the same outcome for standard and test samples when the dose is zero. The analysis can be accomplished by a multiple regression, with the estimator of p being the ratio of the slope estimators. Interval estimates are often obtained using Fieller's theorem.
You can see a sample graph on the left. With PLA 3.0, you are able to calculate slope-ratio assays for each standard/test sample combination in your bioassay seperately or simultaneuosly.
Example report of a slope ratio assay with PLA 3.0
-
Example report of a slope ratio assay with PLA 3.0 81 KB
Based on European Pharmacopoeia, 5th Edition (2005), Chapter 5.3, 5.2.2. - A completely randomised (0,4,4,4)-design - An in-vitro assay of influenza vaccines.

