- Analytical methods
-
PLA 3.0
- About PLA 3.0
-
Analyze your data
- Analyze Biological Potency Assays
- Analyze quantal response assays
- Analyze the dose-response relationship
- Analyze the endotoxin concentration in a substance
- Develop Equivalence margins
- Determine the potency of antibiotics
- Perform a curve comparisons
- Perform a Linearity-of-dilution assessment
- Perform a sophisticated statistical process control
- Perform combination calculations
- Import your data
- Supporting add-ons
- Compliance features
- Deployment
- Try & Buy
- PLA 3.0 Academy
- Support
- Company
Spike-and-recovery analysis
Spike your Test samples with different concentrations of your analyte to identify matrix effects or determine the precision of your assay within the assay range.
Examples of a Spike-and-recovery analysis with PLA 3.0
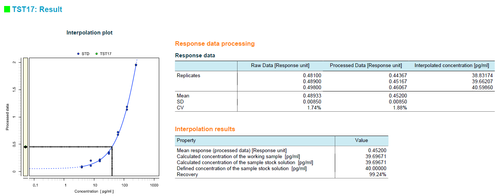
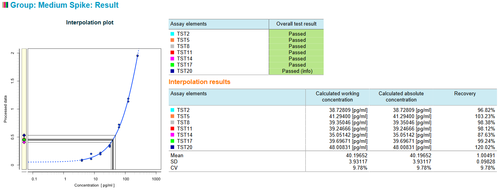
The following image from the 'Spike and recovery analysis' sample document shows Test samples that have been spiked with a pure analyte to a concentration of 40 pg/ml. The response data of all Test samples in the sample document is adjusted by an unspiked Control sample. The interpolation results are displayed in a data plot and as a table.
Example report of a Spike-and-recovery analysis with PLA 3.0
-
Example report of a Spike-and-recovery analysis with PLA 3.0 839 KB
This report shows how to use the Dose-Response Analysis Package for PLA 3.0 to perform spike and recovery analysis. It contains (artificial) observations for a standard sample, 21 test samples, and seven control samples. The standard is measured along a two-fold geometric sequence with seven steps where each measurement is taken in duplicate. Each test and control sample is measured in triplicates. For each sample matrix, three test samples represent the spiked samples, and one control sample represents the unspiked matrix. Spiked samples are assigned a concentration according to the spike, and recoveries are calculated and tested. Additionally, all test samples with the same spike concentration are collected in a report group, and a combined recovery for each group is calculated.

