-
PLA 3.0
- PLA 3.0 Virtual booth
- ---
- Explore PLA 3.0
- Compliance features
- Deployment
- ---
-
Experiments
- Parallel-line potency assays
- Parallel logistic potency assays (3PL, 4PL, 5PL)
- Slope ratio potency assays
- Quantal response potency assays
- Interpolation analysis
- Effective-concentration calculation (ECn)
- Spike-and-recovery analysis
- Cylinder-plate assays
- Turbidimetric assays
- ---
- Analyze the endotoxin concentration in a substance
- Import your data
-
Analyze your data with PLA 3.0
- Analyze Biological Potency Assays
- Analyze quantal response assays
- Analyze the dose-response relationship
- Analyze the endotoxin concentration in a substance
- Develop Equivalence margins
- Determine the potency of antibiotics
- Perform a curve comparisons
- Perform a Linearity-of-dilution assessment
- Perform a sophisticated statistical process control
- Perform combination calculations
- Advanced analysis
- Monitoring
- Supporting add-ons
- ---
- Event Calendar
- News
- Newsletter
- Get started
- Downloads
- Company
What's new in PLA 3.0.5
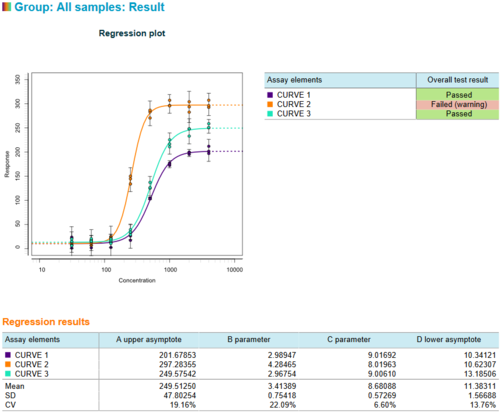
Dose-Response Analysis Package new with PLA 3.0.5
With PLA 3.0.5 we introduce a new add-on: The Dose-Response Analysis Package provides a range of additional biostatistical methods for immunoassays, ELISA, and more. It supports you in investigating equivalence for calm color scheme in line with editor.
Always up to date with PLA 3.0
PLA 3.0.5 always keeps you informed about new extensions and developments. You can easily customize your work environment to get the most out of your installation.
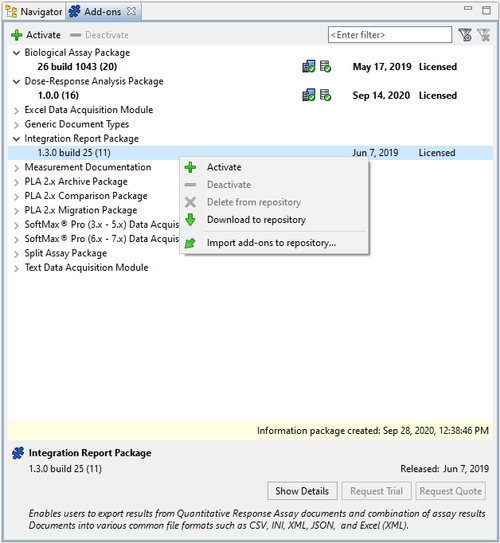
The new Add-on management enables you to benefit from new extensions and developments. Stay informed on new releases and updates such as document packages and data acquisition modules. The Add-on management provides you with a list that is always up to date and puts all suitable add-ons at your fingertips. Just click once to start the add-on download and installation.
Now you can easily extend your work environment with new features. To evaluate them, simply try and use our latest products and integrated tools. You can request add-on trials and licenses with a single mouse click and activate and deactivate them just as easily. We provide demo data in the same location.
The add-on management also provides options to easily install and work with several add-on versions. Simply activate and try the newest add-on versions, or switch to a legacy version to run your legacy assays. You can update to PLA 3.0.5 to benefit from its innovations and still work with add-on versions that have already been validated in your environment.
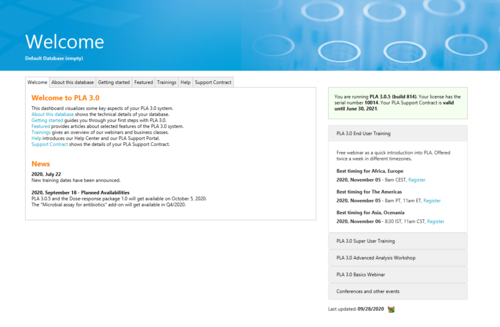
The new dashboard keeps you informed about new developments and events around PLA 3.0.5. It also provides information on the database and can provide information posted by your organization. Last but not least, it displays your license and support status and enables all users to get quick access to help and support.
Usability and performance improvements
Customers who already work with PLA will notice numerous improvements that enhance performance and usability. Our efforts to improve your experience with PLA have streamlined workflows and eliminated redundant tasks.
When you develop a new assay document, PLA 3.0.5 uses the information you provide to automatically set up the data table. When you work with a plate layout, for example, PLA 3.0.5 now arranges the data table to match your layout as you develop the new assay document. In addition, PLA 3.0.5 enables you to easily adjust your data table to employ alternate plate layouts, accommodate data acquisition, or correct assignment errors.
Other improvements in PLA 3.0.5 further enhance the user experience:
- A faster editor and overall performance improvements
- The platform capabilities have been enhanced and now uses a 64-bit software platform.
- Users who create many elements profit of the new feature to create up to 99 samples and other document elements at a time with just three mouse clicks.
Feature overview PLA 3.0.5
Our new PLA 3.0.5 features.
Dose-Response Analysis Package
- Various biostatistical methods
- Interpolation on calibration curves
- Spike-and-recovery analysis
- Linearity-of-dilution assessment
- Effective-concentration calculation
- Curve comparisons
- Equivalence for calibration curves
- Equivalence tests for calibration curves
- Equivalence tests for parameter estimates
- Point estimate tests for parameter estimates
- ANOVA terms
- Equivalence margin development for calibration curves
- Use your historic assay runs to develop acceptance criteria for calibration curves
- Test strategy development
- Visualizations
- Simulations
- Equivalence tests for calibration curves
- Enhanced response data processing
- Data normalization and adjustment
- Use these features, for example, to subtract the absorbance of blank wells or to divide response values by the mean absorbance of maximum binding wells.
- Data transformation
- Logarithmic transformation
- Square transformation
- Square root transformation
- Average replicates
- Adjust the sequence of response data processing steps to your needs / Adjust the sequence of data processing steps
- Data normalization and adjustment
- Subgroup analysis
- Define any subgroups in your experiment
- Subgroups for single- and multi-dose samples
- E.g.: spike-and-recovery analysis
- E.g.: assay optimization
- Subgroup statistics of interpolated results and Dose-response curve characterization
- Averages
- Standard deviations
- Coefficient of variations
- Recovery rate
- Overlay plots
- Define any subgroups in your experiment
- New reports and document dashboards
- More informative document dashboards
- Document definition (e.g.: assay and test system setup)
- Calculation results (overview and in-depth information)
- Graphically improved data plots
- Revised design of reports and dashboards
- Provides greater lucidity
- Fresh and modern look
- Clear, uniformly applied layout and design
- Uniform color scheme in line with editors
- More informative document dashboards
New Add-on management in PLA 3.0
- Benefit from extensions and new developments
- Stay informed on new releases and updates - such as:
- Document packages
- Data acquisition modules
- Have all available add-ons at your fingertips
- Stay informed on new releases and updates - such as:
- Easily customize your work environment
- Request add-on trials and licenses with a single mouse click
- Activate and deactivate add-ons with a single mouse click
- Import demo data
- Easily install and work with several add-on versions
- Simply activate a legacy version to run your legacy assays
- Simply activate and try the newest add-on versions
- Update to PLA 3.0.5 to benefit from its innovations and still work with add-on versions that have already been validated in your environment
New dashboard in PLA 3.0
- Stay informed on
- New developments around PLA 3.0.5
- Events related to PLA 3.0.5
- Information on the database
- Information posted by your organization
- Your license and support status
- Quickly access help and support
Revised data table handling
- Automatically sets up the data table as you develop a new assay document
- Automatically arranges the data table to match your plate layout
- Allows you to easily adjust your data table
- Employ alternate plate layouts
- Accommodate data acquisition
- Correct assignment errors
Refined user experience
- Faster editor, overall performance improvements
- More capable, 64-bit software platform
- New feature: just three mouse clicks to create up to 99 elements at a time


