-
PLA 3.0
- You saw PLA 3.0 at our booth
- ---
- Explore PLA 3.0
- Compliance features
- Deployment
- ---
-
Experiments
- Parallel-line potency assays
- Parallel logistic potency assays (3PL, 4PL, 5PL)
- Slope ratio potency assays
- Quantal response potency assays
- Interpolation analysis
- Effective-concentration calculation (ECn)
- Spike-and-recovery analysis
- Cylinder-plate assays
- Turbidimetric assays
- ---
- Analyze the endotoxin concentration in a substance
- Import your data
-
Analyze your data with PLA 3.0
- Analyze Biological Potency Assays
- Analyze quantal response assays
- Analyze the dose-response relationship
- Analyze the endotoxin concentration in a substance
- Develop Equivalence margins
- Determine the potency of antibiotics
- Perform a curve comparisons
- Perform a Linearity-of-dilution assessment
- Perform a sophisticated statistical process control
- Perform combination calculations
- Advanced analysis
- Monitoring
- Supporting add-ons
- ---
- Event Calendar
- News
- Newsletter
- Get started
- Downloads
- Company
Analyze the dose-response relationship

As an add-on for PLA 3.0, this extension equips you with a comprehensive set of tools to evaluate dose-response relationships in immunoassays, ELISA, and related experiments. You investigate equivalence for calibration curves, process response data in flexible workflows, and review results in dashboards and reports.


Biostatistical methods in the PLA 3.0 Dose-Response Analysis Package
Use the Dose-Response Analysis Package add-on to cover every step of dose-response analysis:
- Interpolation on calibration curves
- Spike-and-recovery analysis
- Linearity-of-dilution assessment
- Effective-concentration calculation (EC50)
- Curve comparisons
- Single curve analysis
- Equivalence margin development
- apply equivalence and point-estimate tests for parameter estimates and ANOVA terms, derive acceptance criteria from historic assay runs, and explore strategy options with visualisations and simulations
Choose from a broad array of regression models. Fit your data to linear and nonlinear models, including Hill equation, 2-, 3-, 4- and 5- parameter logistic models. For example, use the Hill equation for non-linear data ranging from 0 % to 100 % and the 2-parameter logistic model with fixed asymptotes, ideal for smaller or incomplete datasets. The PLA 3.0 dashboard and reports list the model formula and detailed parameter information for transparent evaluation.


![Interpolation plot with blue data points labeled 'STD' and orange points labeled 'TEST - Adjustmented', showing a downward-sloping blue trendline. The x-axis shows 'Concentration [unit]' on a logarithmic scale, and the y-axis shows response values. Error bars are visible on the data points.](/fileadmin/user_upload/Webseiten-Landingpages/Bioassay.de/PLA_3.0/Analyze_your_data/Dose-Response_Analysis_Package/dra_calibration_curve_interpolation_test_sample_plot_adjustedCV.svg "Interpolation plot of a Test sample with response data adjustment by a fixed value of 1")

")


![Interpolation plot showing purple data points for test samples assigned to the Medium-level sample report group, with a blue sigmoidal trendline. The x-axis shows 'Concentration [µg/mL]' on a logarithmic scale, and the y-axis shows 'Response'. Error bars are present on the points.](/fileadmin/user_upload/Webseiten-Landingpages/Bioassay.de/PLA_3.0/Analyze_your_data/Dose-Response_Analysis_Package/dra_linearity_test_sample_group_plot.svg "Interpolation plot for Test samples assigned to the Medium-level sample report group")
Response data processing and subgroup analysis
Shape your data with a step-wise processing pipeline:
- Adjust or normalise by a fixed value or undiluted samples
- Apply logarithmic, square, or square-root transformations
- Arrange processing steps to your preference
- Target all samples, selected samples, or specific plates
- Average across replicates
Define analysis subgroups for single-dose and multi-dose samples to organise spike and recovery studies, assay optimisation, or curve characterisation tasks. Grouped statistics for interpolated values and curve parameters (averages, standard deviations, coefficients of variation, recovery rates, and EC50) are available for direct comparison.
Reports, dashboards, and usability features
- Dashboards and reports display key attributes, parameter estimates, EC50 values, and model equations in a clear, uniform layout.
- Attachments let you view, print, and export plots in high resolution or bundle external files such as SOPs and related data with the assay document.
Elevate your reporting: Export your results to PDFs with ease
Simplify your reporting process by effortlessly creating tailored PDF reports. Additionally, take advantage of our data export capabilities for external data processing.
Example Reports
-
Example report of a Curve Comparison with PLA 3.0 276 KB
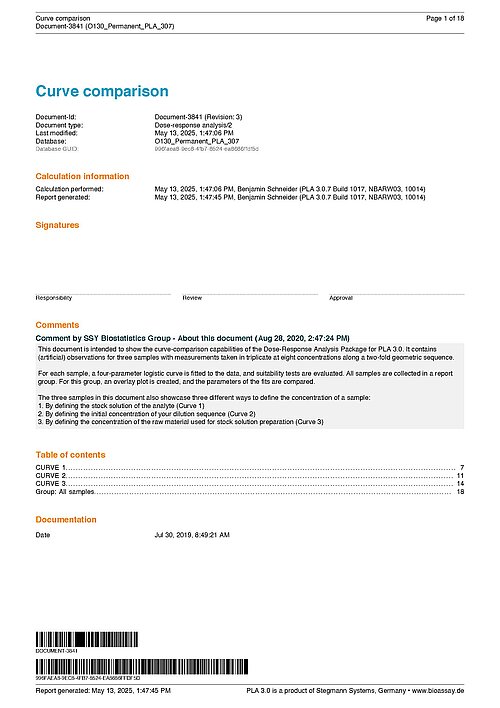
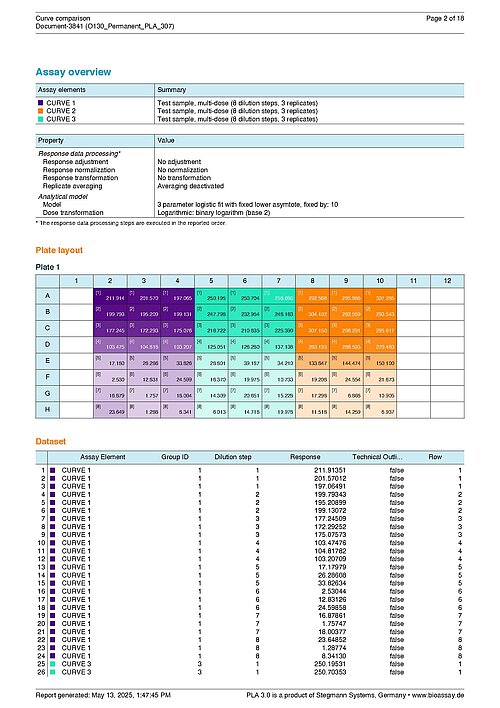
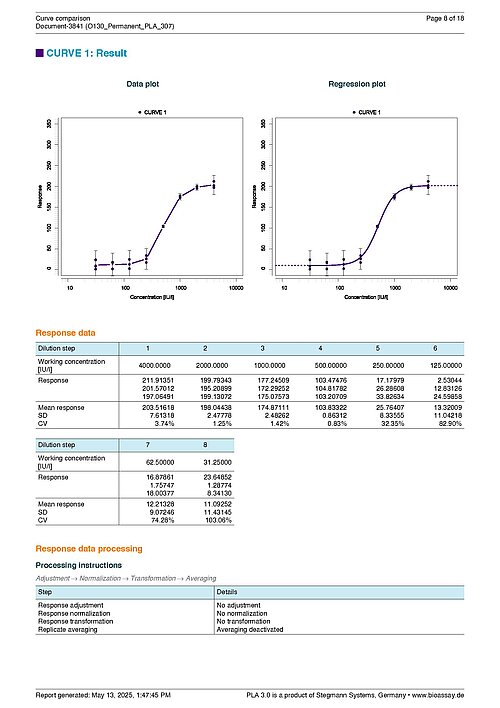
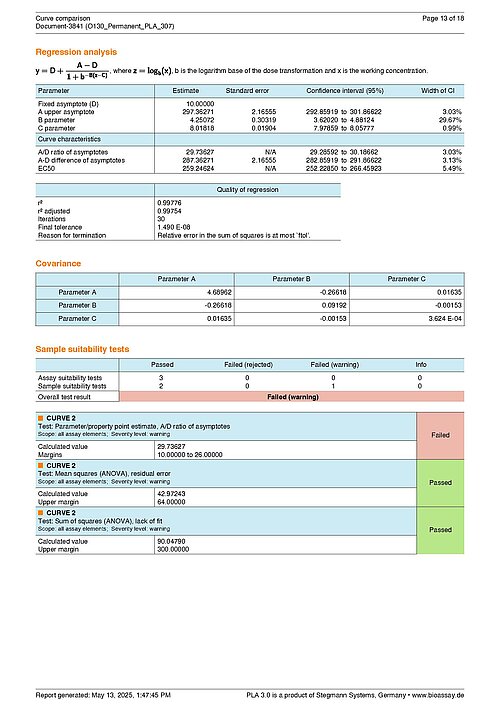
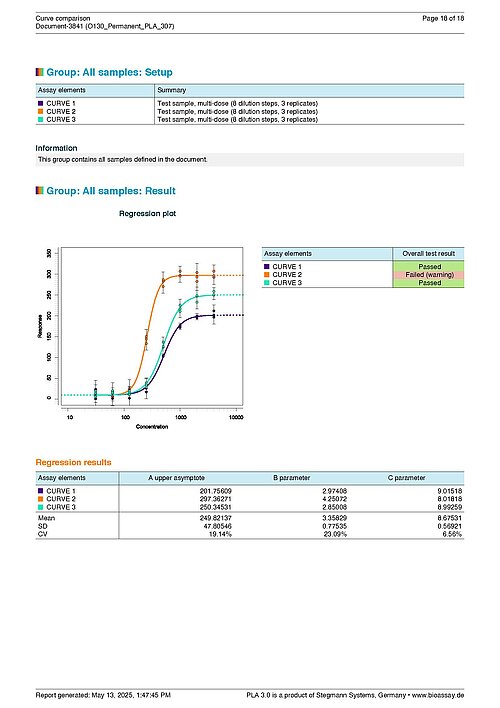
This report is intended to show the curve-comparison capabilities of the Dose-Response Analysis Package for PLA 3.0. It contains (artificial) observations for three samples with measurements taken in triplicate at eight concentrations along a two-fold geometric sequence. For each sample, a four-parameter logistic curve is fitted to the data, and suitability tests are evaluated. All samples are collected in a report group. For this group, an overlay plot is created, and the parameters of the fits are compared. The three samples in this document also showcase three different ways to define the concentration of a sample: 1. By defining the stock solution of the analyte (Curve 1) 2. By defining the initial concentration of your dilution sequence (Curve 2) 3. By defining the concentration of the raw material used for stock solution preparation (Curve 3) -
Example report of an Interpolation Analysis with PLA 3.0 2 MB
This report shows the interpolation capabilities of the Dose-Response Analysis Package for PLA 3.0. It contains (artificial) observations for a four-parameter logistic standard curve and 75 test samples. The standard is measured at seven concentration steps, with three replicates for each concentration. Each test sample is measured with one replicate. Test samples are interpolated against the standard curve, concentrations are determined, and sample suitability tests are evaluated. -
Example report of a Effective Concentration Calculation with PLA 3.0 257 KB
This report is intended to show the capabilities of the Dose-Response Analysis Package for PLA 3.0 for calculating effective concentrations. It contains (artificial) observations for one standard sample and two test samples with measurements taken in triplicate at eight concentrations along a two-fold geometric sequence each. For each sample, a four-parameter logistic curve is fitted to the data. Effective concentrations and EC50 ratios are calculated, and suitability tests are evaluated. The three samples in this document also showcase three different ways to define the concentration of a sample: 1. By defining the stock solution of the analyte (Curve 1) 2. By defining the initial concentration of your dilution sequence (Curve 2) 3. By defining the concentration of the raw material used for stock solution preparation (Curve 3) -
Example report of a Linearity-of-dilution assessment with PLA 3.0 479 KB
This report shows how to use the Dose-Response Analysis Package for PLA 3.0 to perform linearity of dilution assessment. It contains (artificial) observations for a standard sample and 12 test samples. The standard is measured along a two-fold geometric sequence with seven steps where each measurement is taken in duplicate. Each test sample is measured in triplicate. The test samples are grouped into three groups of four samples each, corresponding to a serial dilution of three underlying samples representing three different initial concentrations. The concentration of the undiluted (neat) sample is assigned to all diluted samples of its group, and recoveries are calculated and tested. Additionally, all test samples belonging to the same 'neat' sample are collected in a report group, and a combined recovery for each group is calculated. -
Example report of a Spike-and-recovery analysis with PLA 3.0 940 KB
This report shows how to use the Dose-Response Analysis Package for PLA 3.0 to perform spike and recovery analysis. It contains (artificial) observations for a standard sample, 21 test samples, and seven control samples. The standard is measured along a two-fold geometric sequence with seven steps where each measurement is taken in duplicate. Each test and control sample is measured in triplicates. For each sample matrix, three test samples represent the spiked samples, and one control sample represents the unspiked matrix. Spiked samples are assigned a concentration according to the spike, and recoveries are calculated and tested. Additionally, all test samples with the same spike concentration are collected in a report group, and a combined recovery for each group is calculated.
Please note: The Dose-Response Analysis Package is not intended for relative potency calculations, as those are covered by the Biological Assay Package.